


搜索


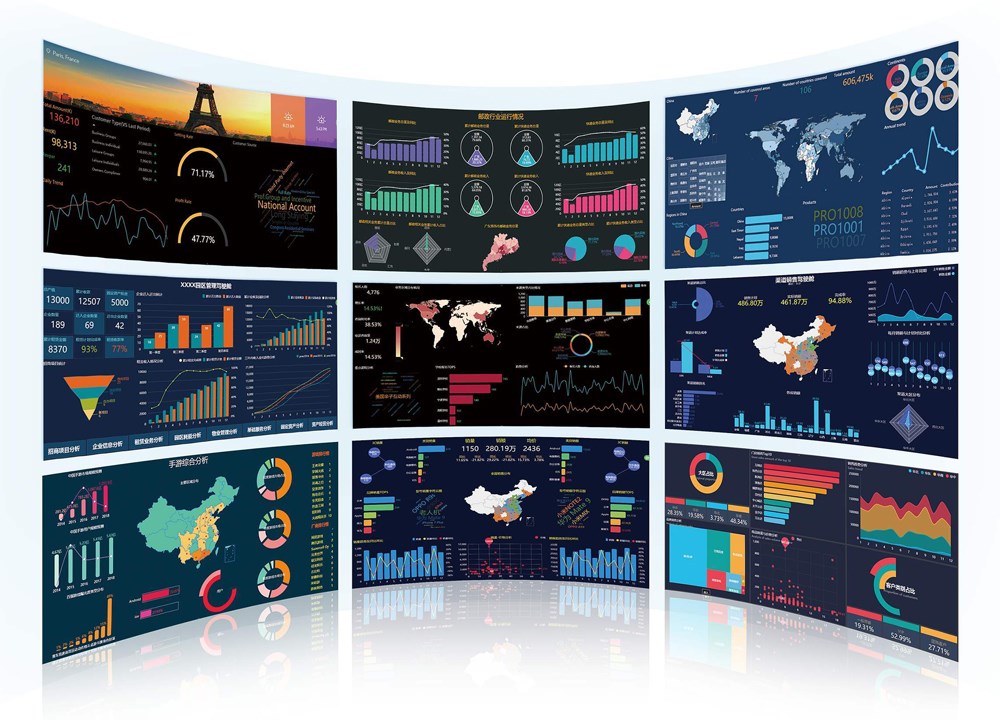
Data Visualization
Information
Advantages:
Easy to understand:
Using graphics and charts to display data can make it easier for people to understand the data.
Improving visibility:
Using graphics and charts to display data can improve its visibility.
Highlighting key points:
Using graphs and charts to display data can highlight the key points of the data and make important information more prominent.
Improving efficiency:
Using graphics and charts to display data can improve the efficiency of data analysis.
Simplify complex data:
Using graphs and charts to present data can simplify complex data and make it easy to understand.
Decision support:
Using graphics and charts to display data can assist decision-making and help people make smarter decisions.
Improving communication efficiency:
Using graphics and charts to display data can improve communication efficiency and help people communicate and collaborate better.
Better data comparison:
Using graphs and charts to display data can better compare differences and trends between different data.
Better data operability:
Using interactive visualization technology can provide better data operability, allowing users to filter, sort, and other operations on the data.
Enhanced data perception:
Using graphics and charts to present data can enhance people's perception of the data and help them discover new insights and patterns from the data.
Better data memory:
By using graphs and charts to present data, the human brain can better remember the data because the memory of graphs and charts is better.
Better data sharing:
Visualized data can be better shared with other people because graphics and charts are easier to understand and communicate
Saving time and resources:
Using data visualization technology can save time and resources, as graphs and charts can provide a large amount of information in a short period of time without the need to read a large amount of data.
Support for mobile devices:
The current data visualization tools and technologies support mobile devices, allowing for anytime, anywhere viewing and analysis of data on mobile devices.
Data visualization for non professionals:
Data visualization is also very friendly to non professionals, and through graphics and charts, data can be more easily understood without the need for professional knowledge.
- Products Fine PitchRentalDOOHCommercialSportCreativeXRAcceaaories
- SolutionData VisualizationCommercial DisplayDOOH BillboardsStage RentalDigital StadiumConference RoomSecurity MonitoringXR Studio
- Showcases VisualizationCommercialConferenceDOOHStageSportXR studio
- EventsNews
- SupportTechnical SupportAfter-serviceService NetworkDownload
- About usProfileCultureTalentsContact
-

+86-136 2007 8587
-

+86-136 2007 8587
-

-

JY Building, SKW industrial park, Tangtou Community, Shiyan Town, Bao'an, Shenzhen, 518108, China.


Micro LED | COB | LED Rental Screen | LED Commercial Display | DOOH LED Billboard | Stadium LED Video Wall |
GOB | MicroLED | All-in-one Smart LED System | Creative LED
Copyright 2008-2025. SHENZHEN RGBVISIONLED TECHNOLOGY CO LTD. All rights reserved.
info@szrgbvisionled | +86 13620078587
Micro LED | COB | LED Rental Screen | LED Commercial Display | DOOH LED Billboard | Stadium LED Video Wall |
GOB | MicroLED | All-in-one Smart LED System | Creative LED
Copyright 2008-2025. SHENZHEN RGBVISIONLED TECHNOLOGY CO LTD. All rights reserved.
info@szrgbvisionled | +86 13620078587


